What Verdigris Signals detects
High-frequency waveform analysis identifies degradation undetected by standard BMS, power quality issues, and abnormal load patterns.
UPS Rectifier Degradation Detection
Detects rectifier degradation that standard alarms miss. Shipped on UPS systems today.
Multi-Asset Detection Framework
Degradation detection that generalizes across asset classes. See the coverage roadmap below.
Forensic Power Analysis
Event-triggered 8 kHz waveform capture provides sub-second forensic evidence for outage investigations. One facility avoided millions in misattributed exposure using timestamped waveform records.
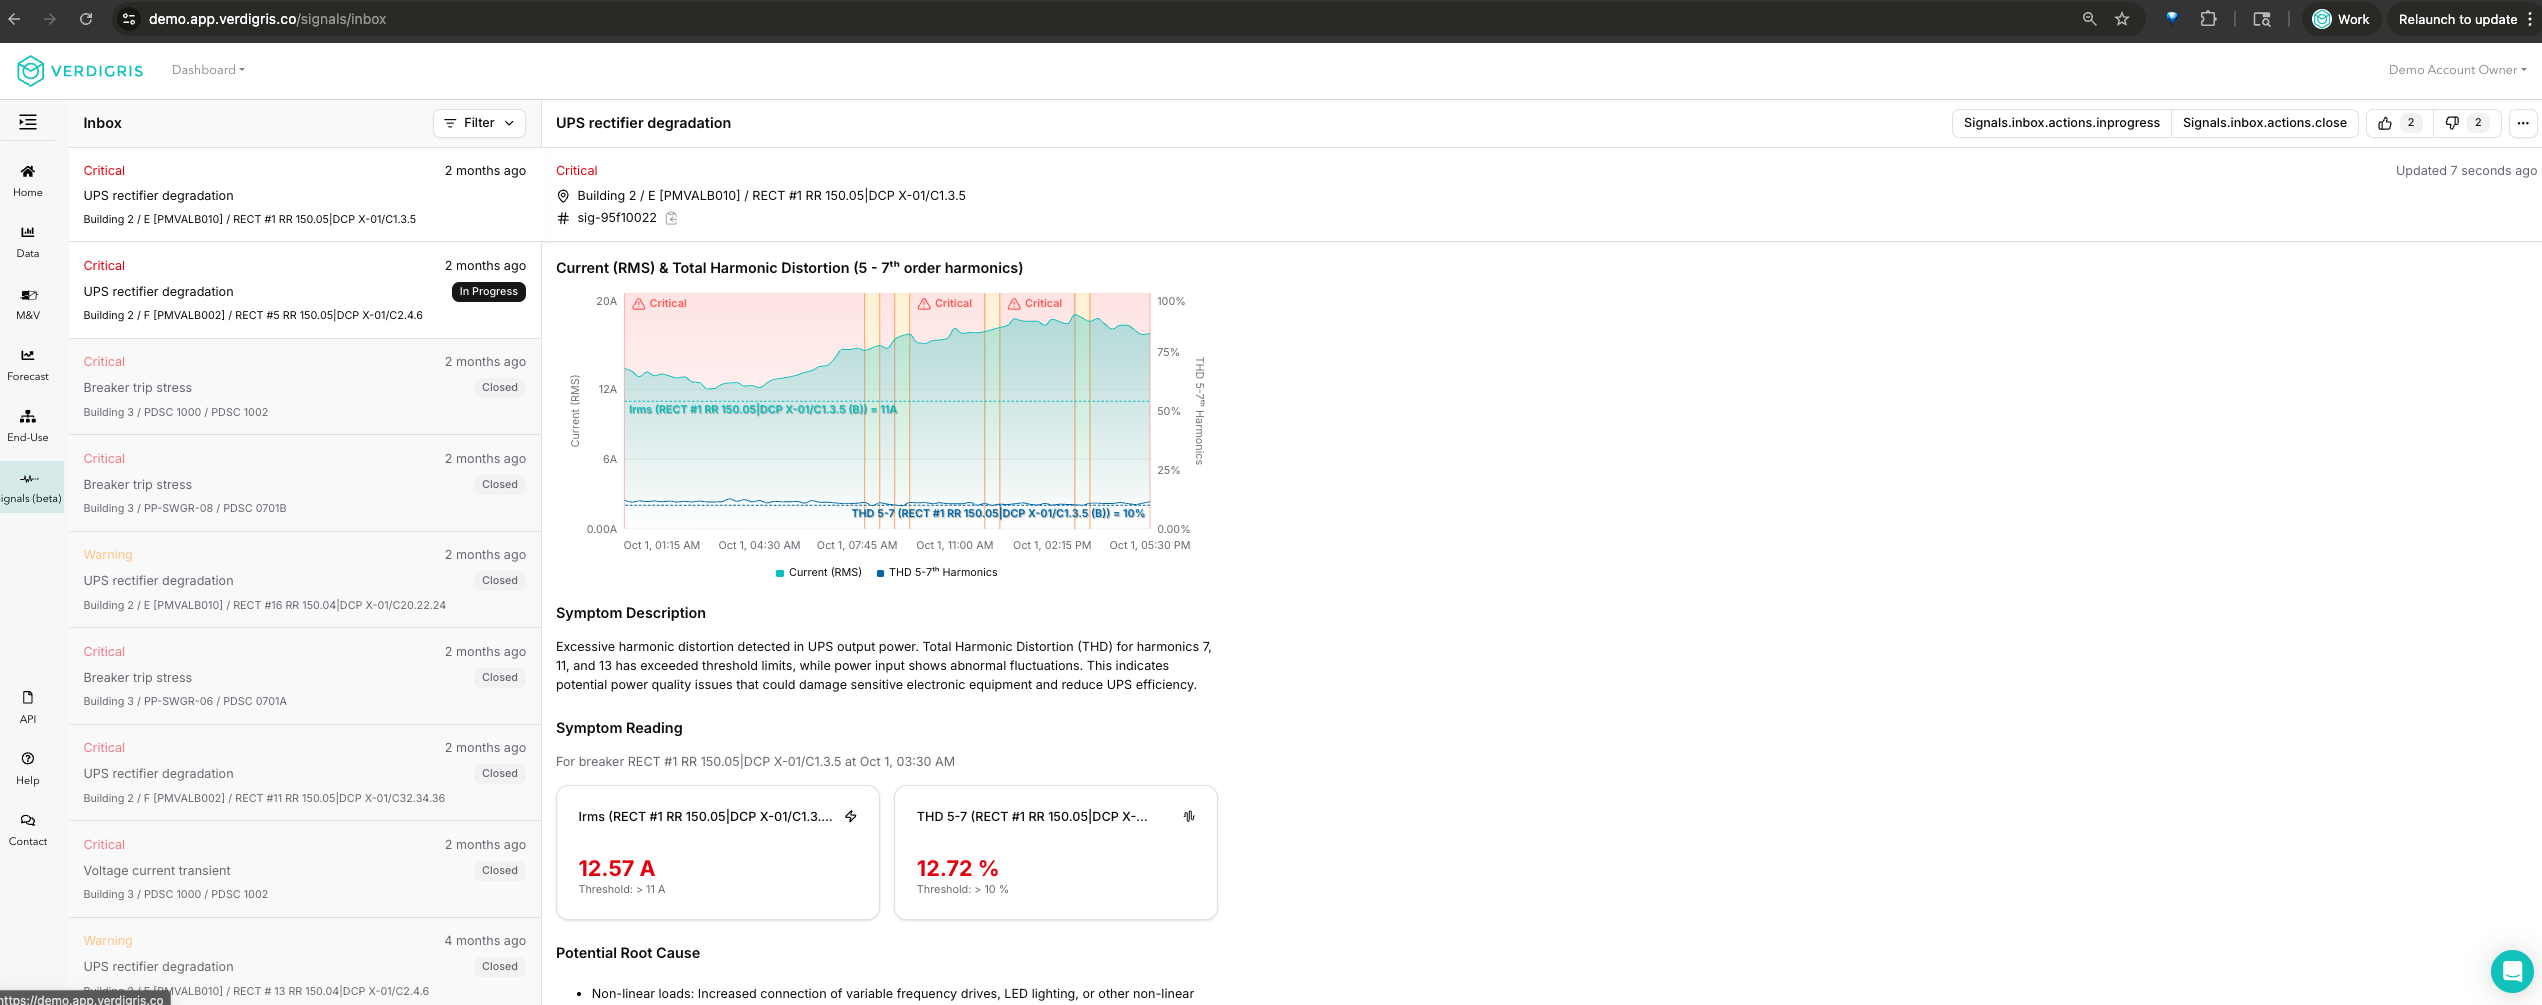
From waveform to work order in 30 seconds
- Detection. Verdigris continuously monitors 8 kHz electrical waveforms across all circuits.
- Analysis. 5th/7th harmonic THD analysis identifies signature degradation patterns.
- Alert. Alerts appear in your Inbox workflow with less than 30 seconds latency.
- Action. Ops engineers review alerts, investigate root cause, and schedule maintenance via ServiceNow, Prometheus/Grafana, or Slack.
- Resolution. Preventive maintenance scheduled before failure occurs.
Why standard monitoring misses this
Standard BMS systems poll power data at 1 Hz: one reading per second. At that resolution, a 200-millisecond harmonic spike from a degrading rectifier capacitor appears as a normal reading. The degradation is real, progressing, and invisible.
Verdigris captures 8,000 samples per second. At 8 kHz, that same 200 ms spike produces 1,600 data points, enough to identify the specific harmonic signature (5th and 7th order THD elevation) that indicates capacitor stress.
This is not a software difference. BMS, DCIM, and power quality meters designed for steady-state monitoring cannot retroactively increase their sampling rate. The physics requires high-frequency capture at the point of measurement.
Every load has a unique electrical fingerprint
Voltage plotted against current produces a phase portrait, a shape as distinctive as a fingerprint. At 8 kHz, these patterns are visible on every monitored circuit, continuously.
As DC-link capacitor ESR (equivalent series resistance) rises with age, harmonic content shifts in a measurable, repeatable pattern. A healthy rectifier ages into a fault, and H7 rises first.
The H5/H7 ratio is the diagnostic indicator
In early-stage capacitor degradation, the H5/H7 ratio shifts while total THD barely moves.
Degradation no standard alarm caught
Across T-Mobile data center facilities, every degrading unit Signals flagged was caught before any standard BMS alarm fired.
The deployment's projected 3-year value is $1.3M to $3M, at a 6:1 ROI with a 5-month payback.
We were surprised to see issues our existing systems didn't catch. It built immediate trust.
What should we detect next?
The same 8 kHz waveform analysis that caught UPS degradation generalizes to any electrical asset on a monitored circuit. Vote on what we tackle next in Signals Lab, our public coverage roadmap.
| Asset Type | Status |
|---|---|
| UPS systems | Shipped |
| Switchgear & transfer switches | Planned |
| Transformers | Planned |
| Generators | Planned |
| PDUs & power distribution | Planned |
| CRAC / CRAH units | Planned |
| Chillers & cooling plant | Planned |
| CDUs & liquid cooling | Planned |
| Pumps, fans & VFDs | Planned |
What asset types matter most to your operations? Two ways to shape what Signals detects, by commitment level:
Co-design what Signals detects next
Signals Founding Access is a sponsored co-development cohort for AI data center operators. Verdigris funds the hardware and the engineering; you bring the floor and help define the signals before launch. Applications are reviewed on a rolling basis.
Not ready to commit? Vote on coverage in Signals Lab, our public roadmap, free and open to everyone.
Hardware and related capabilities
Our EV2 power meters capture 8 kHz waveform data that makes Verdigris Signals detection possible.
- Verdigris EV2 Power Meters. Standard circuit-level monitoring.
- Verdigris EV2 Pro Power Quality. Forensic waveform capture for mission-critical environments.
Stop reacting to failures. Start preventing them.
See how Signals detects degradation that standard monitoring misses. Pricing varies by deployment size and configuration.