Phase Imbalance Trending Identifies Cooling Tower Gearbox Degradation
How one operator detected a cooling tower gearbox failure 3 months early using only electrical data, converting a potential $250K–$300K emergency into planned maintenance and eliminating $600K–$2M+ in SLA risk exposure.
Early Warning
Before failure threshold
SLA Risk Avoided
Unplanned cooling capacity loss during peak load
October Days
Showed sustained degradation pattern
Standard Alarms
BMS showed all towers healthy until gearbox noise
We had no indication from our existing systems that anything was wrong. Verdigris showed a clear pattern indicating an issue with the tower. Upon investigation, we confirmed a structural issue with the gearbox. Had we not switched to our backup tower, the shaft would've failed, causing a catastrophe.
The Challenge
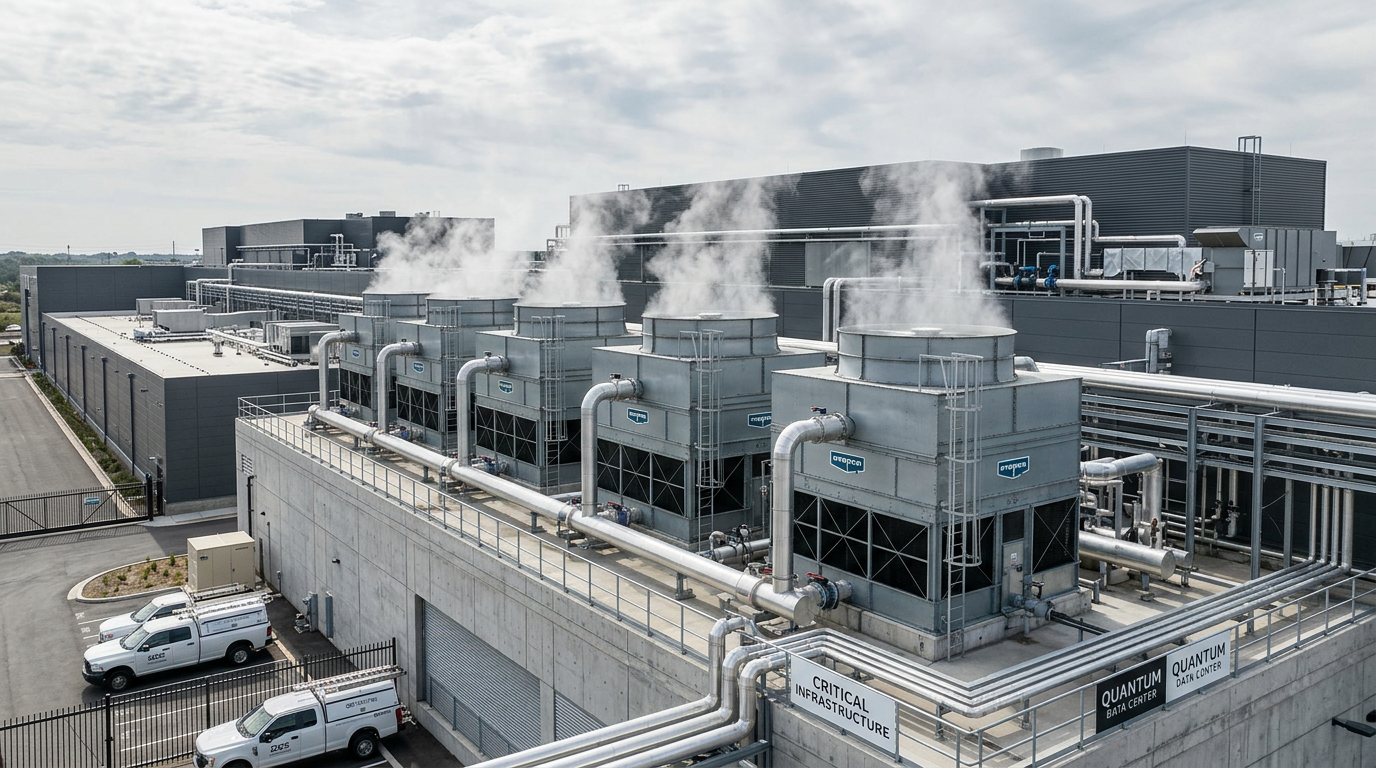
A Tier-1 urban data center facility faced a critical decision. The central cooling plant's BMS and standard power monitoring showed all cooling towers operating normally. No alarms. No anomalies. Green across the board.
But the operations team had started hearing abnormal noise from Cooling Tower 3's gearbox. They had no way to quantify severity, trajectory, or urgency from their existing monitoring stack. They were stuck between two bad options:
Wait for catastrophic failure. Unplanned loss of cooling capacity during peak load. A single cooling tower failure cascades: reduced condenser capacity overloads remaining chillers, risking thermal runaway across the facility. Industry benchmarks place data center downtime at $5K–$17K per minute. Even a brief cooling emergency during peak load represents $600K–$2M+ in SLA risk exposure.
Shut down on gut feel. Pull a tower offline without data-backed justification, reducing N+1 redundancy and potentially overloading the remaining cooling plant.
Standard monitoring could not tell them if they had weeks or months before failure.
The Approach
Verdigris deployed high-resolution power monitors capturing continuous electrical waveforms on the cooling tower VFD circuit. No sensors on the rotating equipment itself.
Phase Imbalance Trending
The approach treats phase imbalance signatures as progressive degradation indicators, similar to how rising blood pressure predicts a cardiac event before symptoms appear. The system tracks directional trends, not static thresholds.
| Capability | Standard Monitoring | Verdigris |
|---|---|---|
| Sampling rate | 1 Hz (1/second) | 8 kHz (8,000/second) |
| What it measures | Averaged power, energy, voltage | Per-phase current deviation, harmonics, progressive trends |
| Detection method | Static thresholds | Directional trending |
| Mechanical fault visibility | None | Phase imbalance translates gearbox stress into electrical signal |
| Fleet context | Each asset isolated | Comparative analysis across peer towers |
| Time horizon | Point-in-time snapshots | Historical rolling trendlines, weeks to months of lead time |
Three capabilities drove the detection:
- Phase imbalance trending: 10-day rolling average of 3-phase current deviation as an early indicator of motor/gearbox mechanical stress translating into electrical asymmetry
- Comparative fleet analysis: Benchmarks target tower against peers on the same cooling plant, separating real degradation from normal operational variation
- Escalation logic: Sustained trendline exceedance over 10/30/60-day windows, progressive severity rather than point-in-time snapshots
The Results
Verdigris identified a clear, worsening degradation pattern on one cooling tower. The operator's existing monitoring saw nothing. The electrical signal told the full story three months before the gearbox would have failed, using data already flowing through the facility's infrastructure.
Timeline
| Period | Event |
|---|---|
| Apr–Jul 2025 | Normal operating condition |
| Aug 2025 | Phase imbalance elevated; 78% of operating days exceed 12% trendline threshold |
| Sep 2025 | 90% of operating days exceed threshold; confirmed equipment-specific degradation |
| Oct 2025 | Proactive, planned shutdown executed; manual inspection confirmed gearbox fault |
| Nov 2025 | Scheduled repair completed; service restored |
| Jan 2026 | Confirmed in Verdigris |
Impact
By detecting the gearbox failure 3 months early, the operator converted a potential $250K–$300K emergency repair into a planned maintenance event. More critically, the proactive shutdown eliminated $600K–$2M+ in SLA risk exposure from unplanned cooling capacity loss during peak load.
| Before Verdigris | After Verdigris |
|---|---|
| Emergency response: Reactive dispatch after failure | Emergency response: Eliminated. Emergency converted to planned maintenance |
| Maintenance: Time-based replacement on schedules | Maintenance: Condition-based, proactive shutdown with 3 months lead time |
| Fleet visibility: Binary, running or broken | Fleet visibility: Continuous health trendline per tower |
| Cooling redundancy: Unknown which tower closest to failure | Cooling redundancy: Quantified, comparative health scoring across all towers |
Why This Matters
The operator's existing monitoring stack (BMS, EPMS, DCIM, and standard power quality tools) showed Cooling Tower 3 as healthy right up until the operations team heard the gearbox failing. Verdigris's 8 kHz waveform capture and phase imbalance analysis provided mechanical fault visibility through electrical data alone, no sensors on the gearbox required.
This changes how the team makes decisions across the cooling fleet: targeted intervention on the tower that needs it, remaining towers confirmed healthy with data, and N+1 decisions informed by quantified comparative health.