Unlock Deeper Insights with the New Energy End-Use Breakdown View
With the End-Use view, you can now see precisely how energy is used across your facility, presented in an intuitive and actionable format.

Facility sustainability demands measurable action, not aspirational statements. We built the End-Use breakdown view to help teams meet ESG targets with verified data.
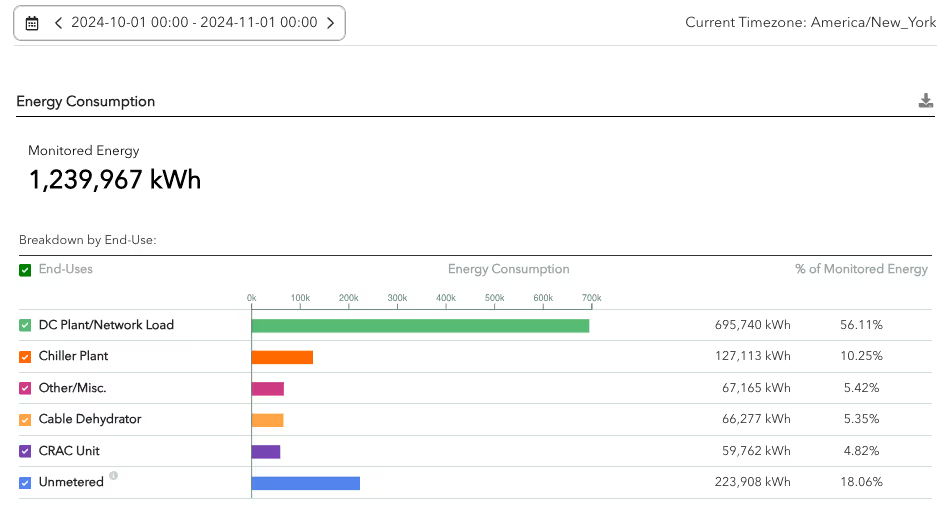
The End-Use view gives sustainability and facilities teams granular visibility into energy consumption by equipment category, load type, and operational zone. Your team can identify the top 10% of energy consumers. You can measure kWh per end-use category and track month-over-month changes.
A Clearer Picture of Your Energy Consumption
The End-Use view shows you precisely how your facility consumes energy, in an intuitive and actionable format.
- Track usage by operational area with precise kWh measurements.
- Visualize consumption distribution with clear percentage breakdowns.
- Spot major energy consumers to uncover optimization opportunities.
- Support data-driven decisions for impactful sustainability reporting.
This granularity turns raw meter data into a prioritized list of efficiency opportunities, ranked by kWh impact.
Dive Into Energy Trends
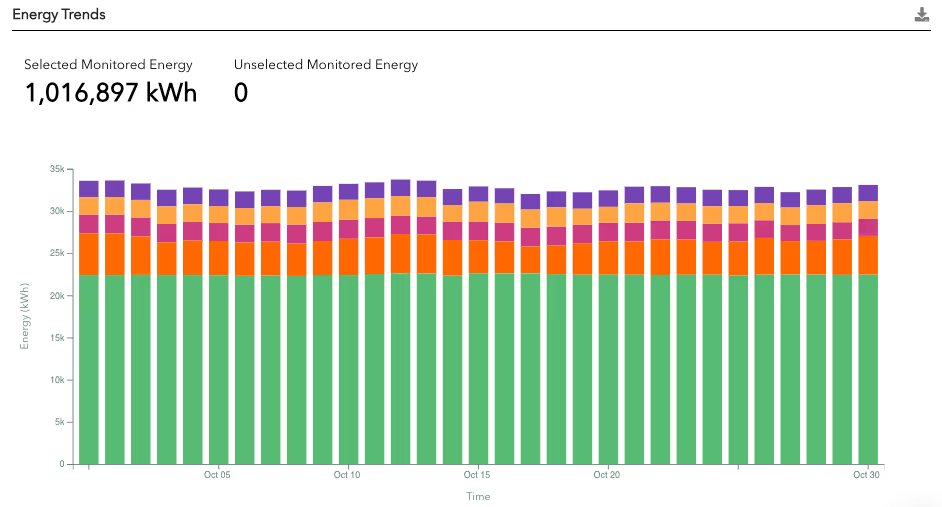
Understanding your energy trends helps you meet reduction targets and demonstrate impact. The Analytics dashboard now offers enhanced trending capabilities:
- Monitor energy consumption patterns over time with dynamic kWh visualizations.
- Calculate sustainability metrics like power usage effectiveness (PUE).
- Track your progress toward energy reduction goals.
- Generate actionable insights for ESG reporting and stakeholder engagement.
Present PUE trends to leadership or identify HVAC scheduling gaps. The End-Use breakdown keeps teams focused on measurable outcomes.
Ensure Accurate Data for Better Decisions
Accurate, reliable data drives sustainability goals. We built tools into the Analytics dashboard to keep your data quality high:
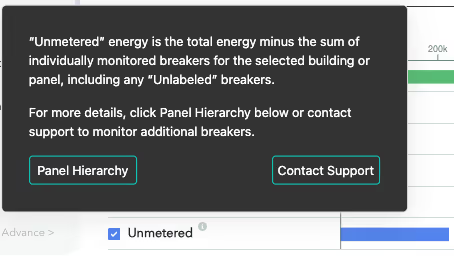
- Quickly identify and address unlabeled energy consumption.
- Monitor unmetered energy usage.
- Use built-in validation and categorization tools for a comprehensive energy overview.
These features give you confidence that your sustainability reports reflect precise, transparent data.
Get Started Today
Ready to explore your energy patterns and find new efficiency opportunities? Getting started takes three steps:
- Log in to the Analytics dashboard.
- Navigate to the new "End Use" tab.
- Start exploring and optimizing your facility's energy usage.
For additional support, contact your Customer Success representative or email us at support@verdigris.co.