Announcing the New Verdigris Analytics Dashboard
The new Verdigris Analytics dashboard delivers faster load times, a more intuitive interface, and fewer clicks to get the answers you need.
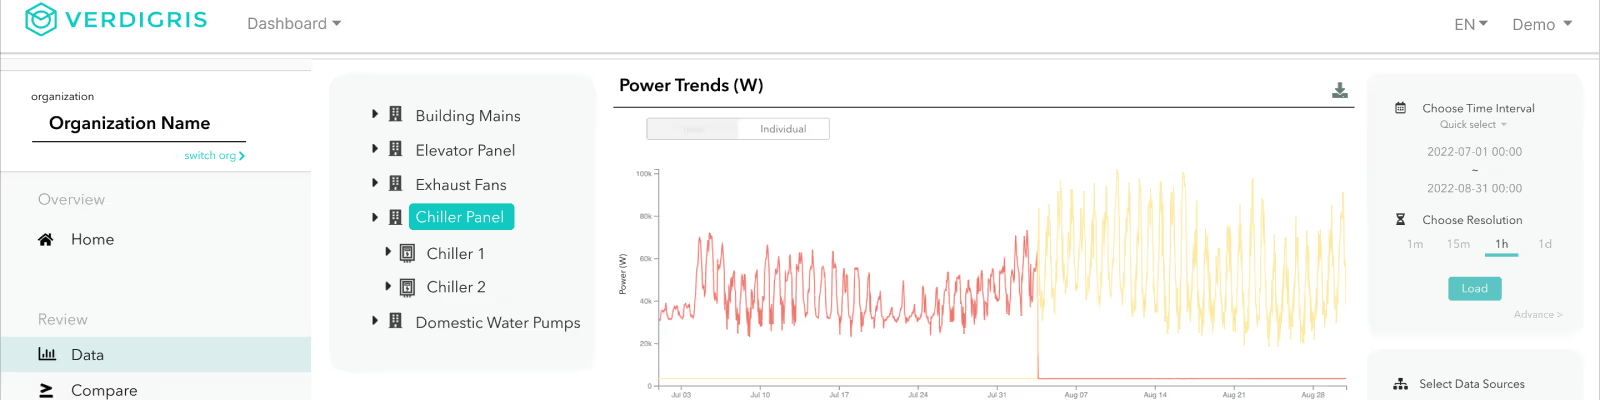
We’re excited to release the new Verdigris Analytics dashboard, following positive feedback from customers during the beta period.
This release delivers significant improvements to the user experience, providing energy managers and facility engineers faster load times, a more intuitive interface, and fewer clicks to get the answers you need.
Here are the key updates:
Navigate your portfolio for the desired panel or breaker level data in a few taps
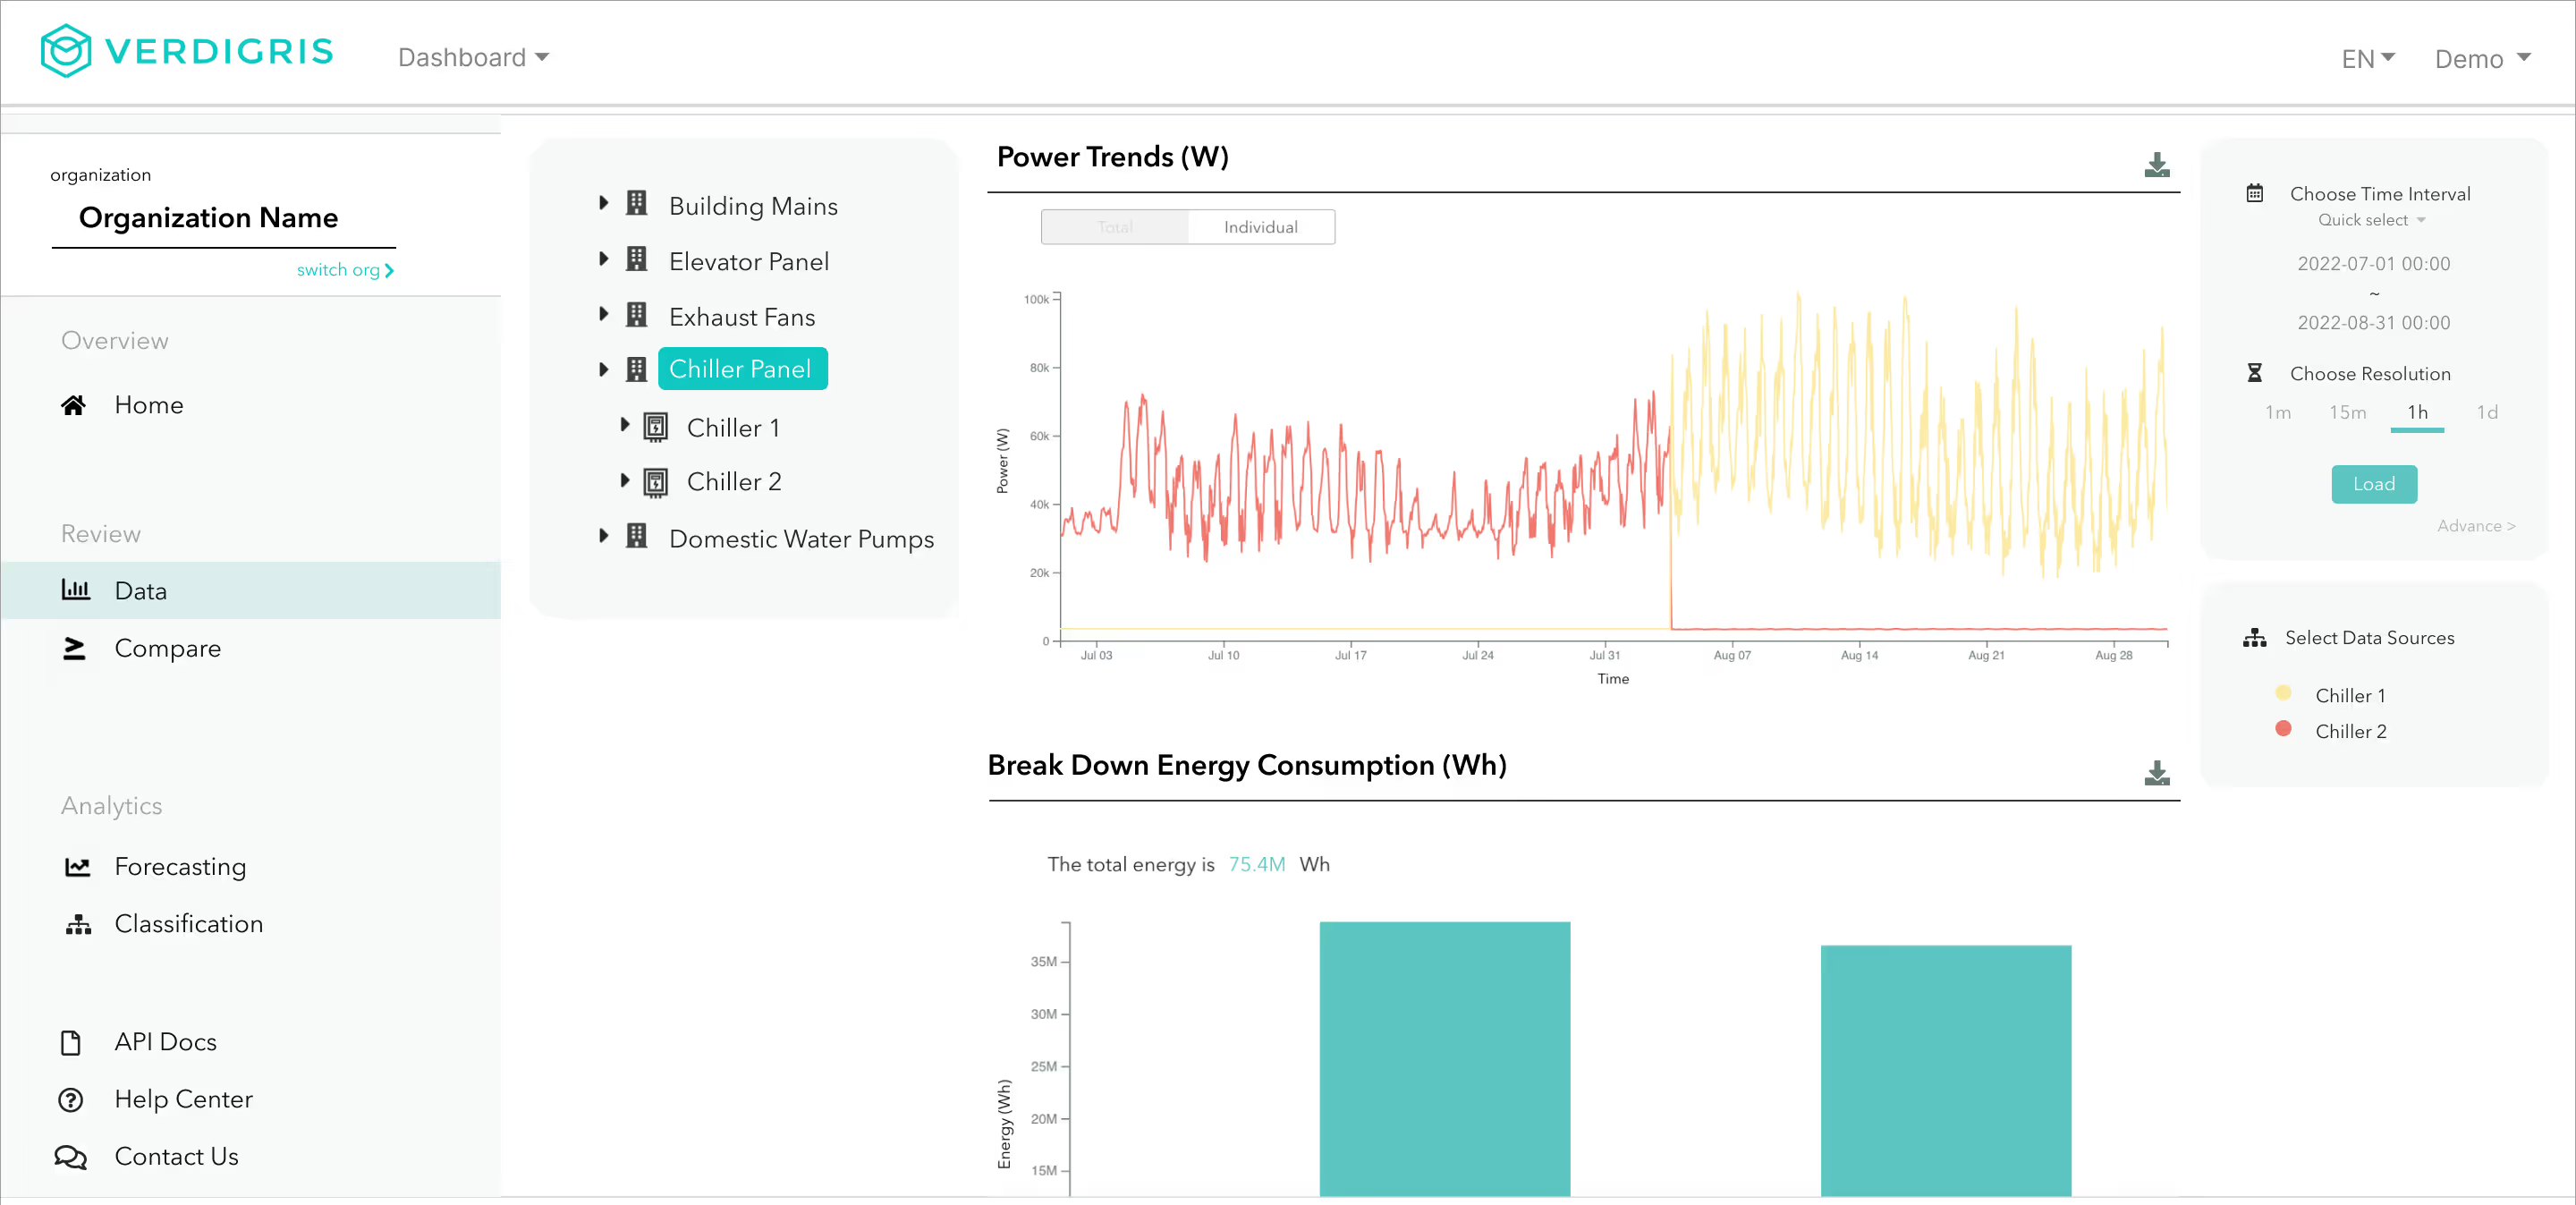
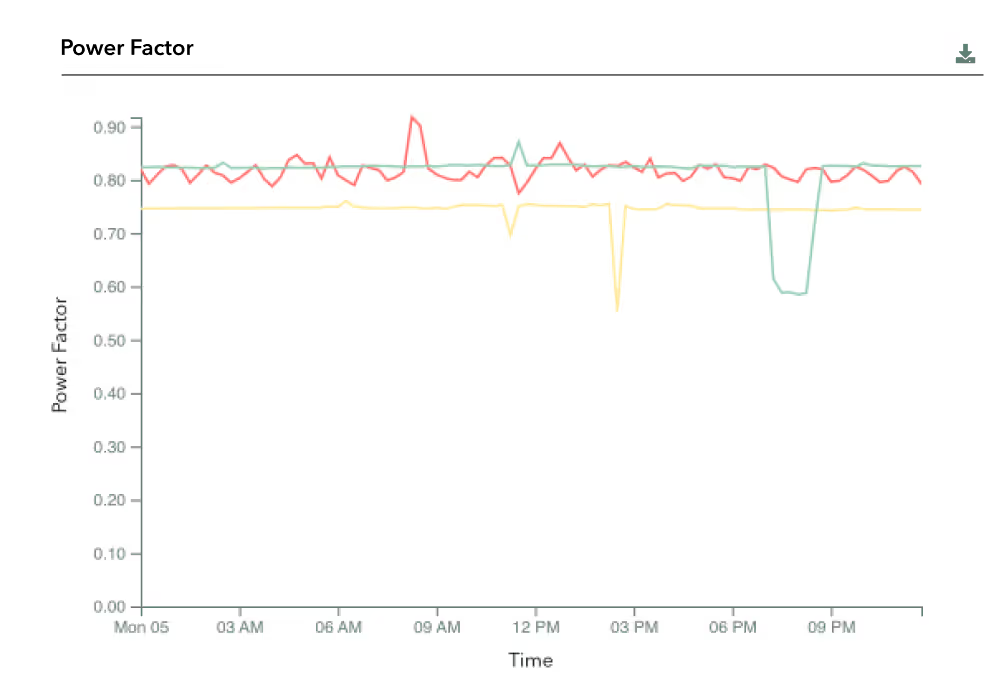
View minutely energy trends and power quality data within seconds of query time
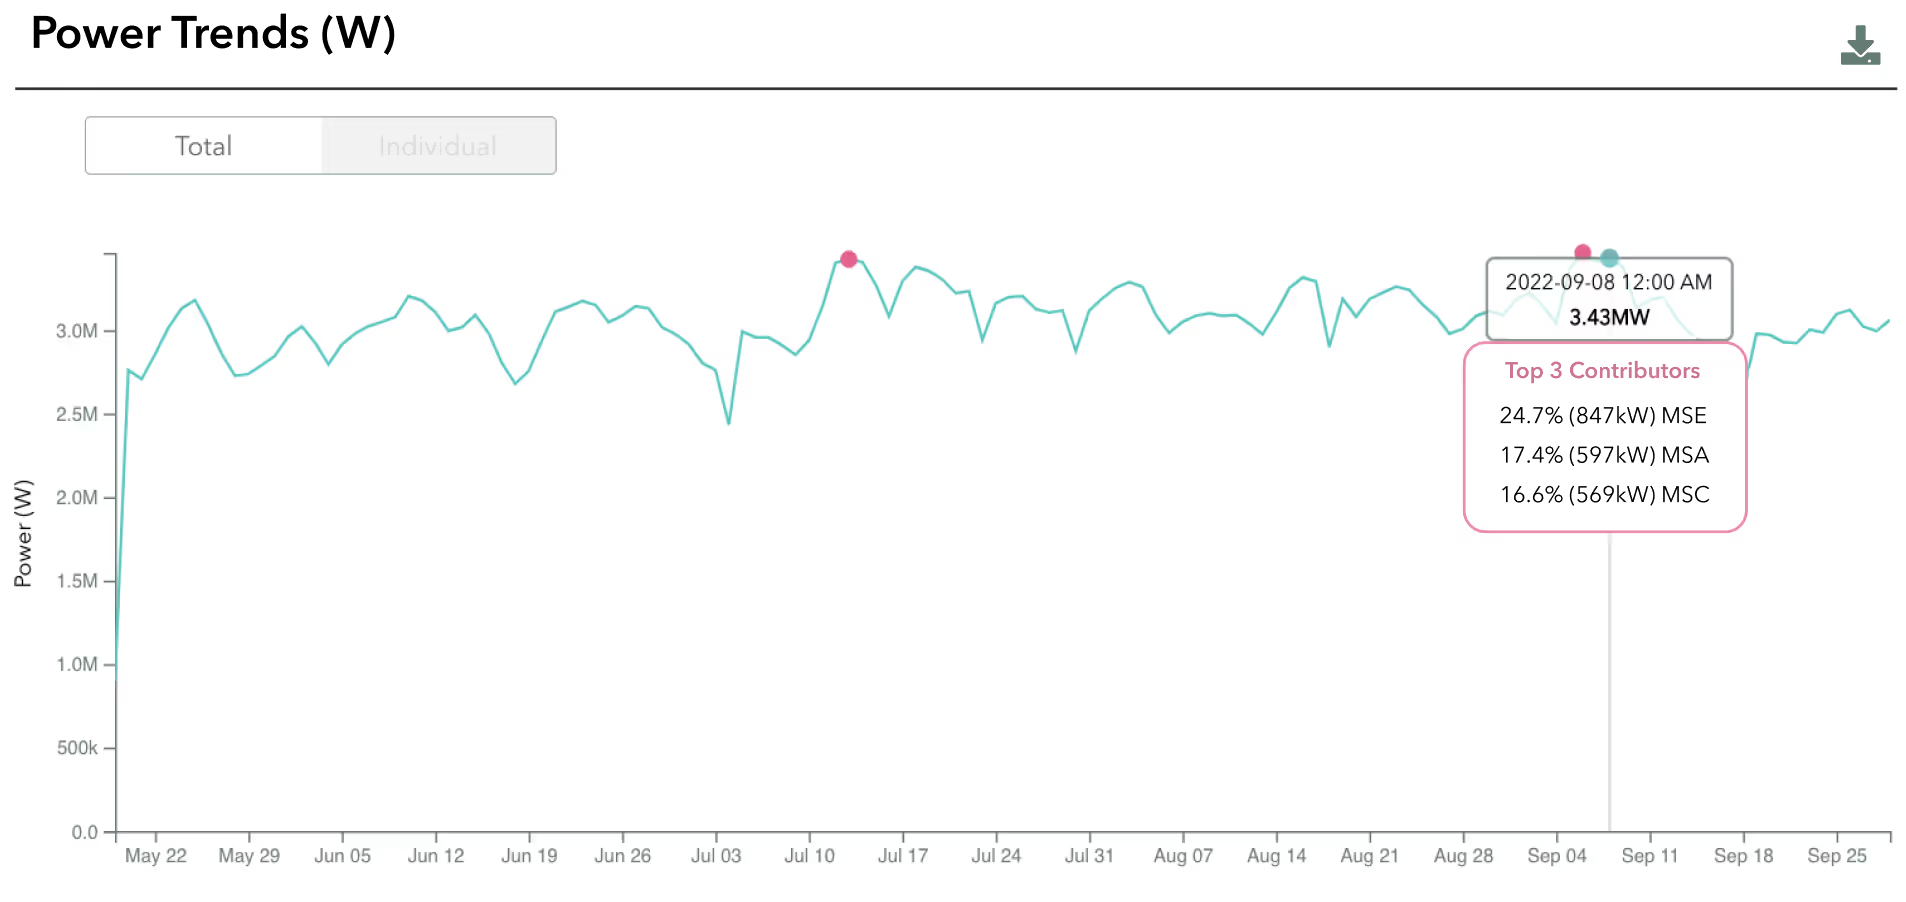
Quickly see the top 3 demand contributors over the desired time and interval
Analyze energy trends with overlaid temperature patterns from local weather stations in °F and °C
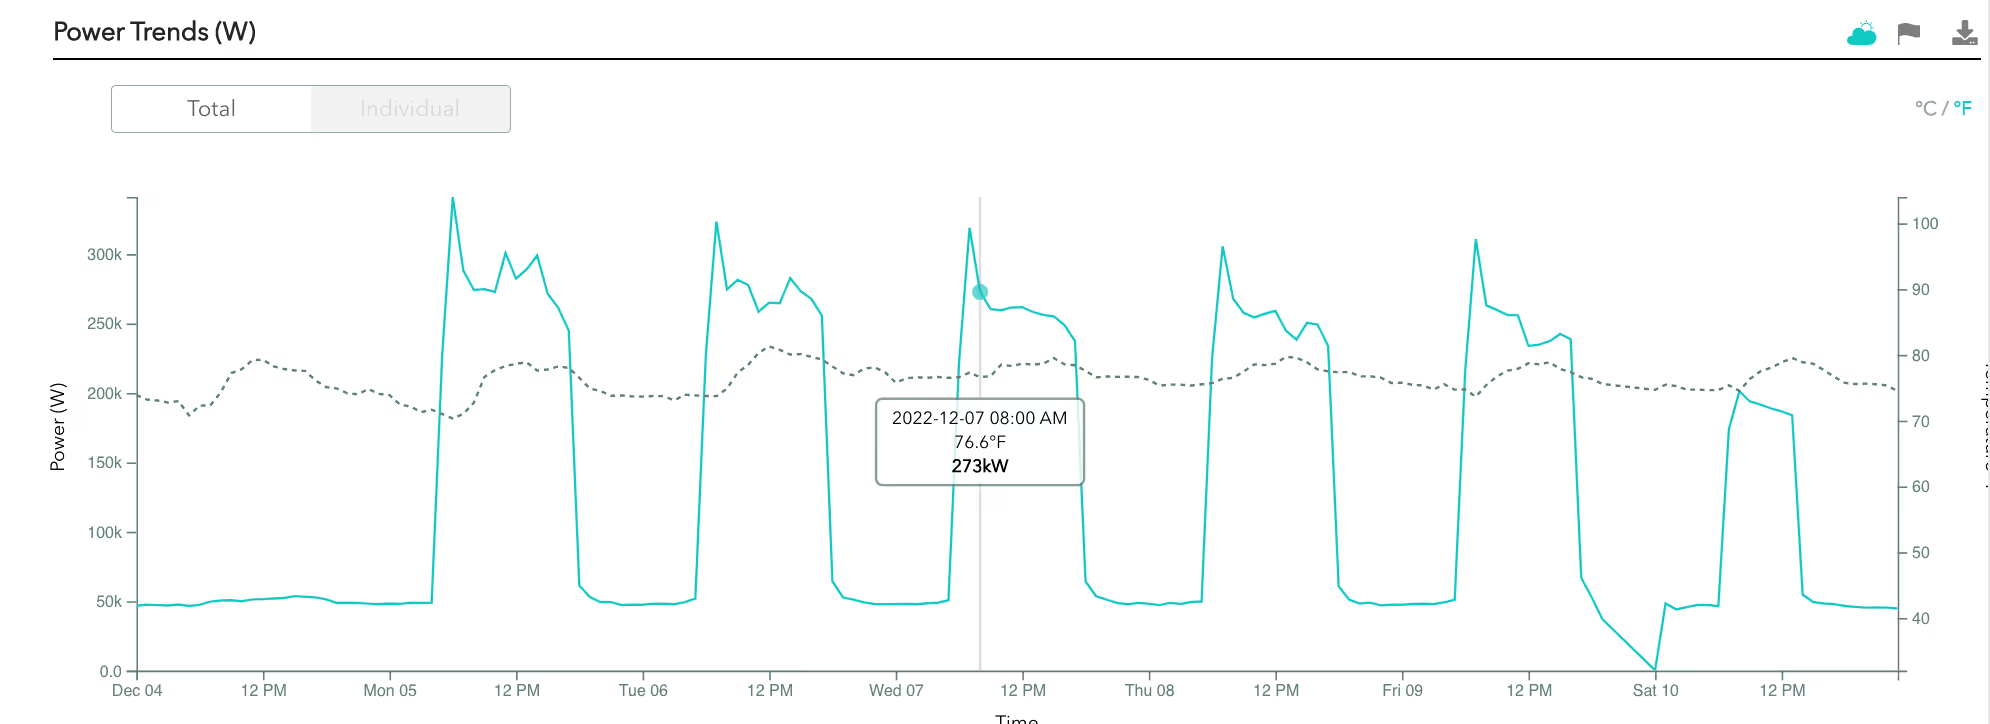
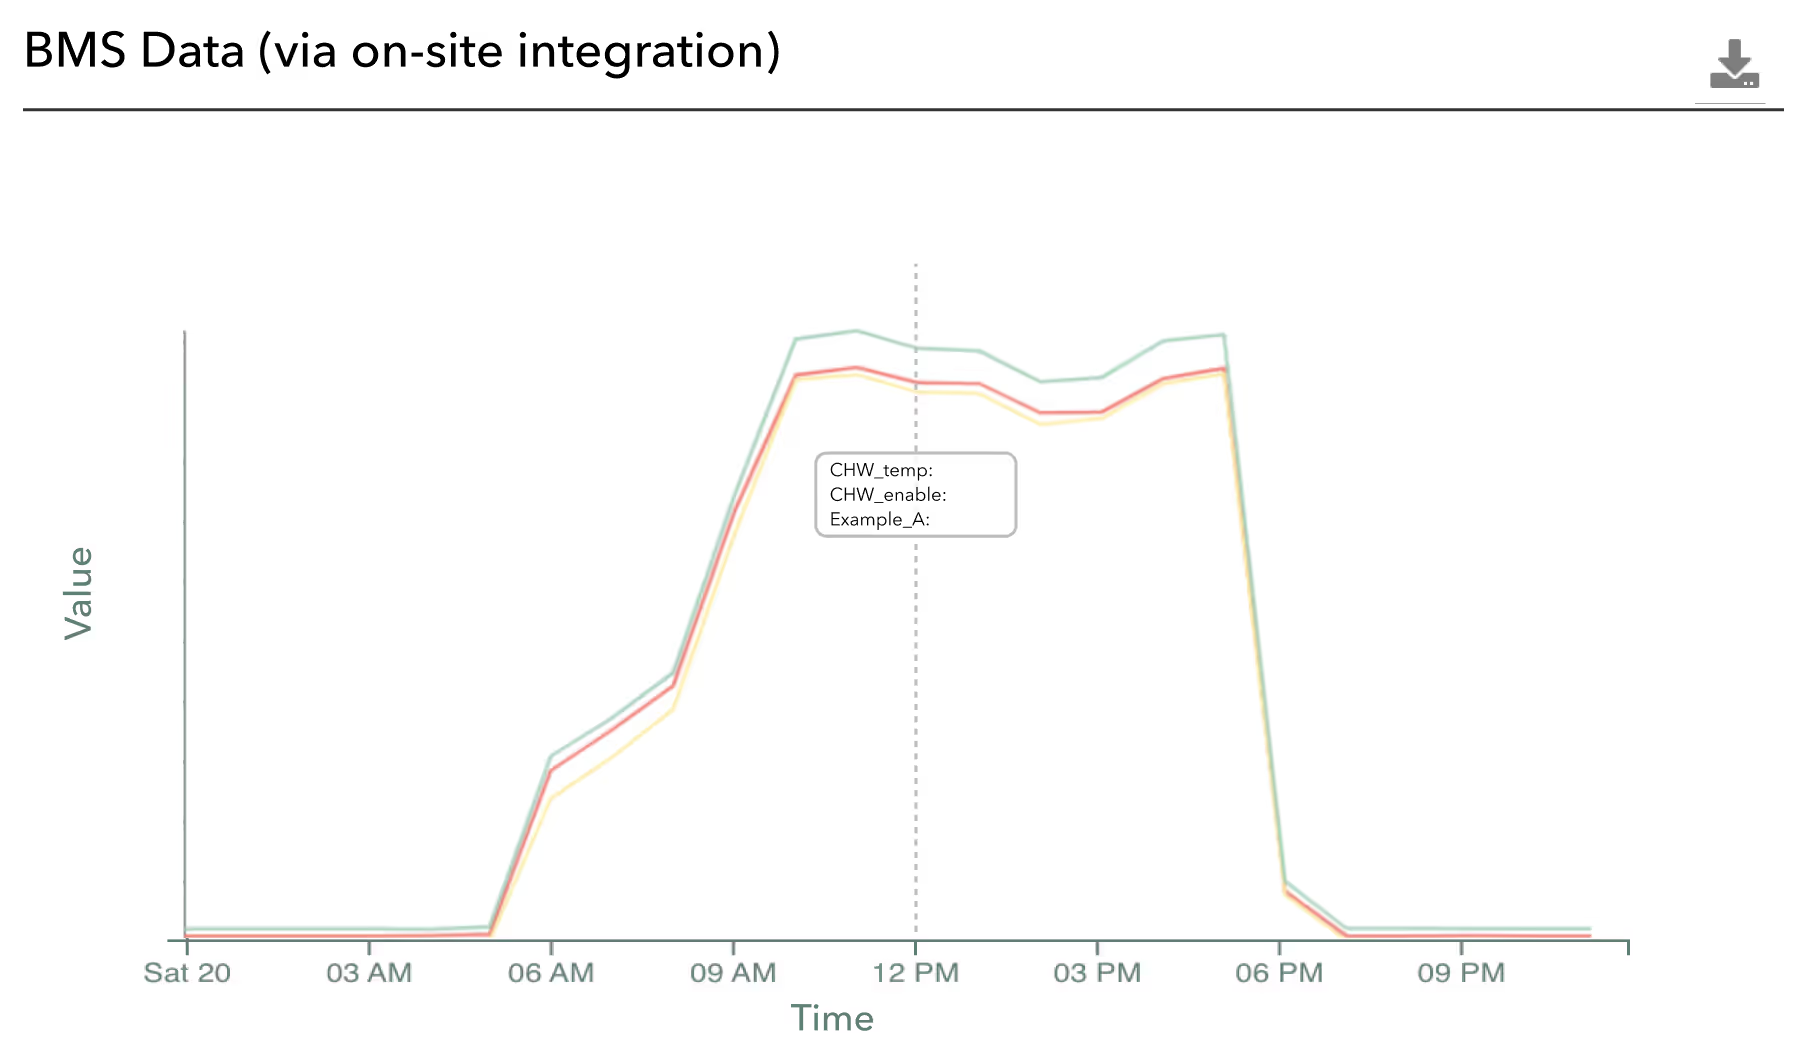
Compare energy and integrated BMS data trends side by side
For customers who want to continue to use the previous version of the dashboard, it will continue to be available at classic.verdigris.co.
As always, we'd love to hear what you think.